Map Styling
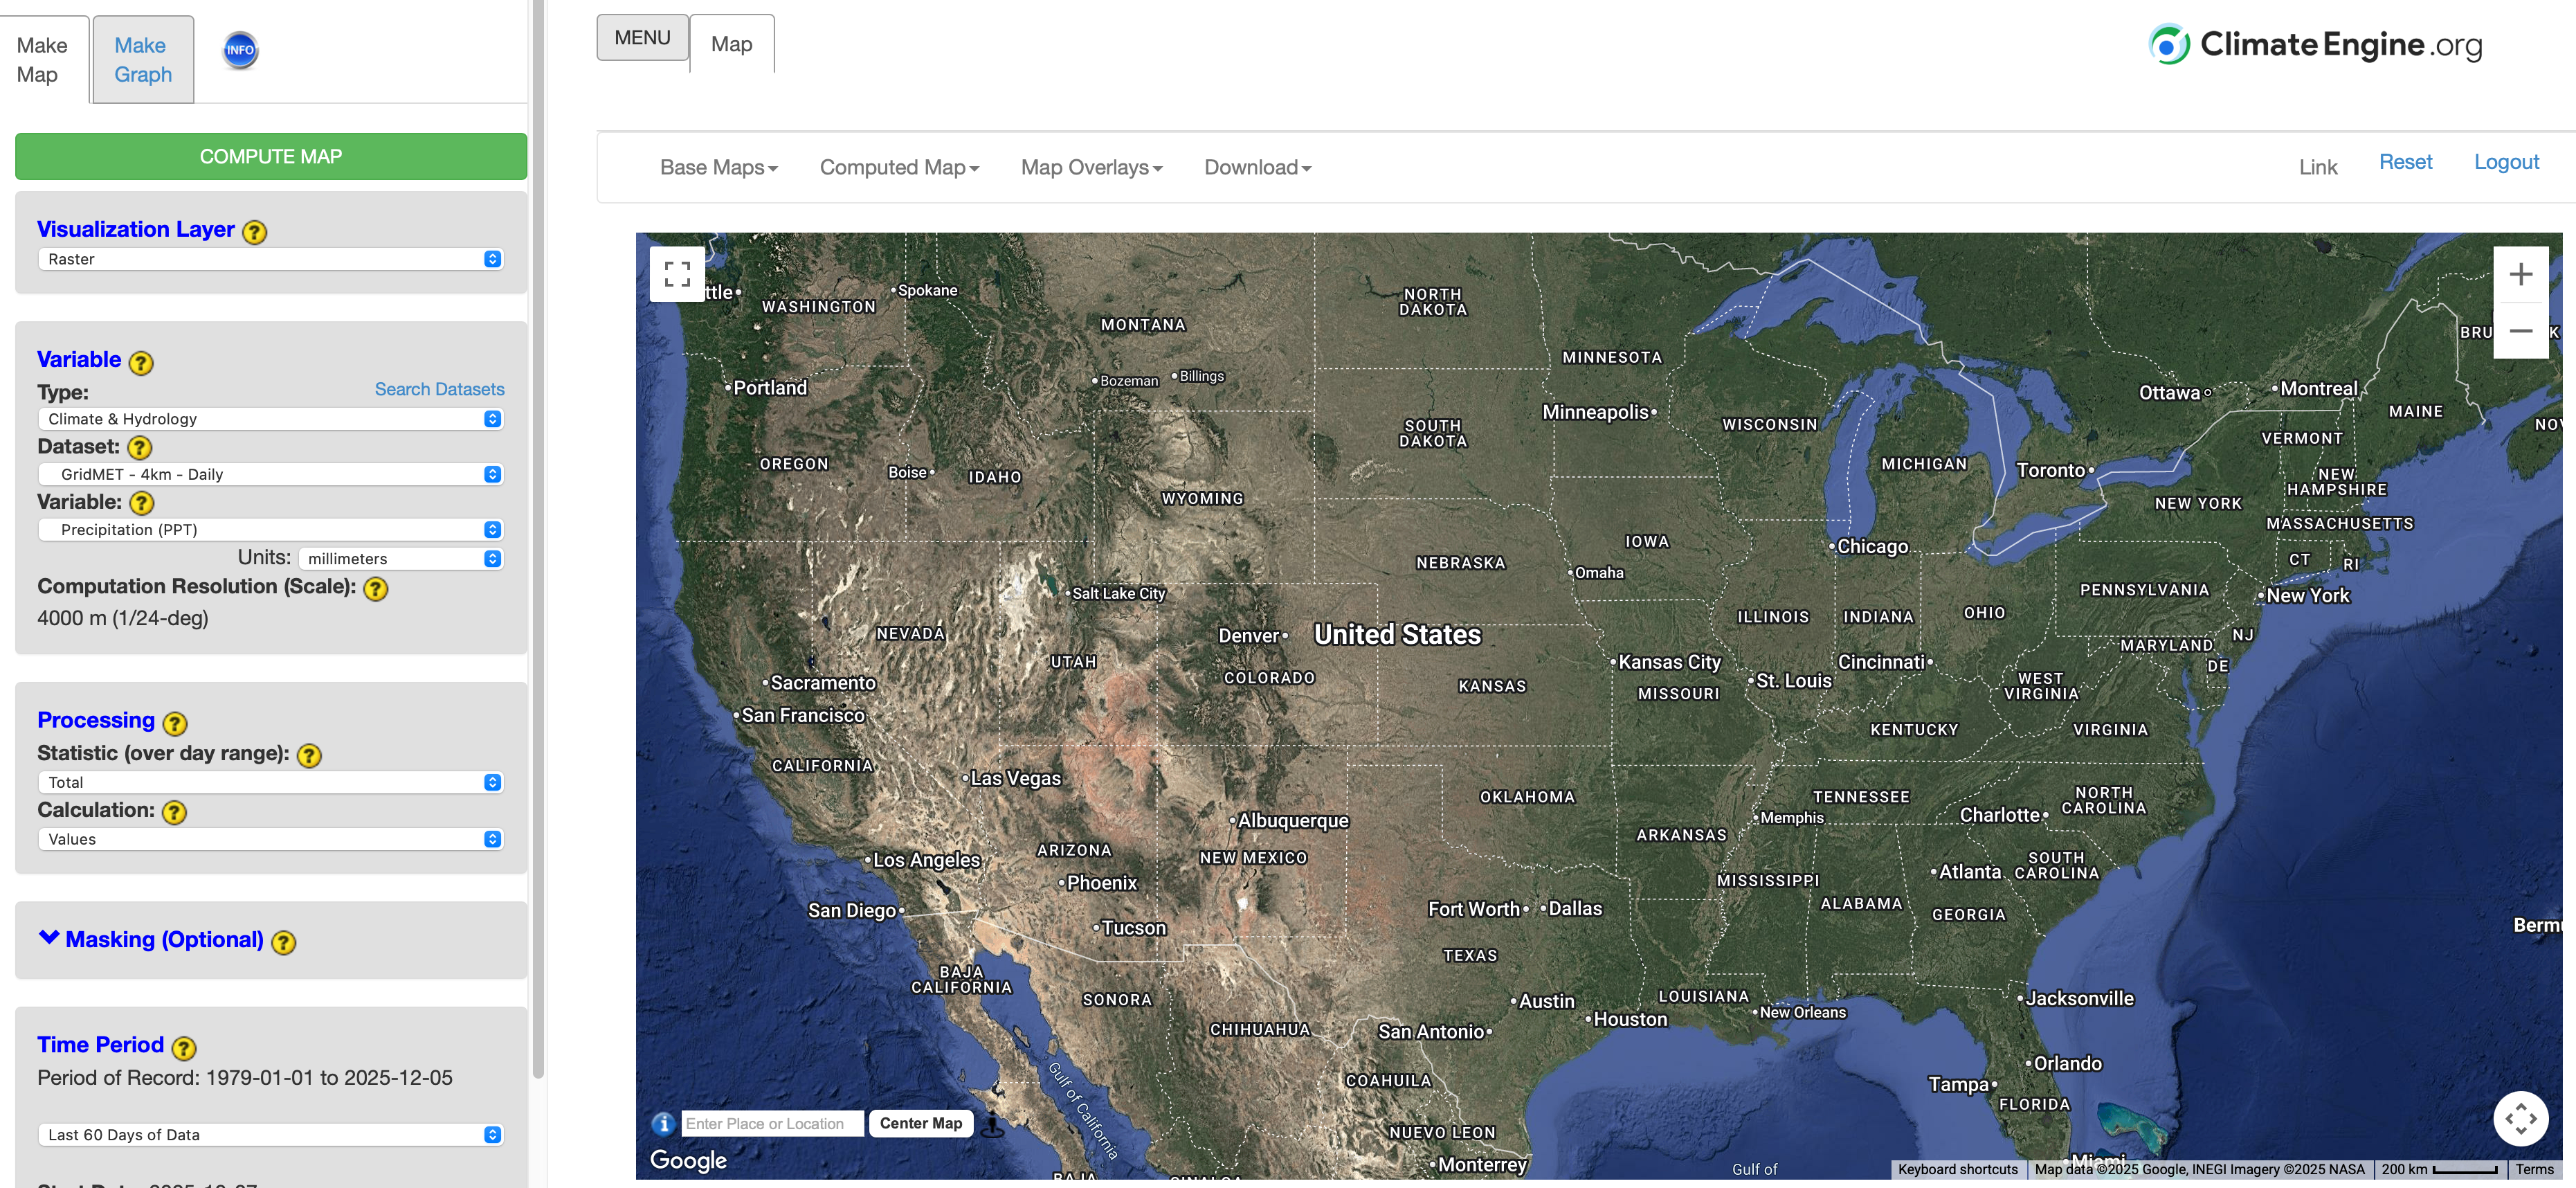
Your map can be customized in a variety of different ways. From the panel at the top, you can modify the color scale, change the base map, or add layers to better visualize map boundaries.
Color Ramps
The app allows you to customize your map with modification of the color palette. You can view the options available by clicking on Computed Map located on the selection panel directly above the map. A dropdown will open with Color Options.
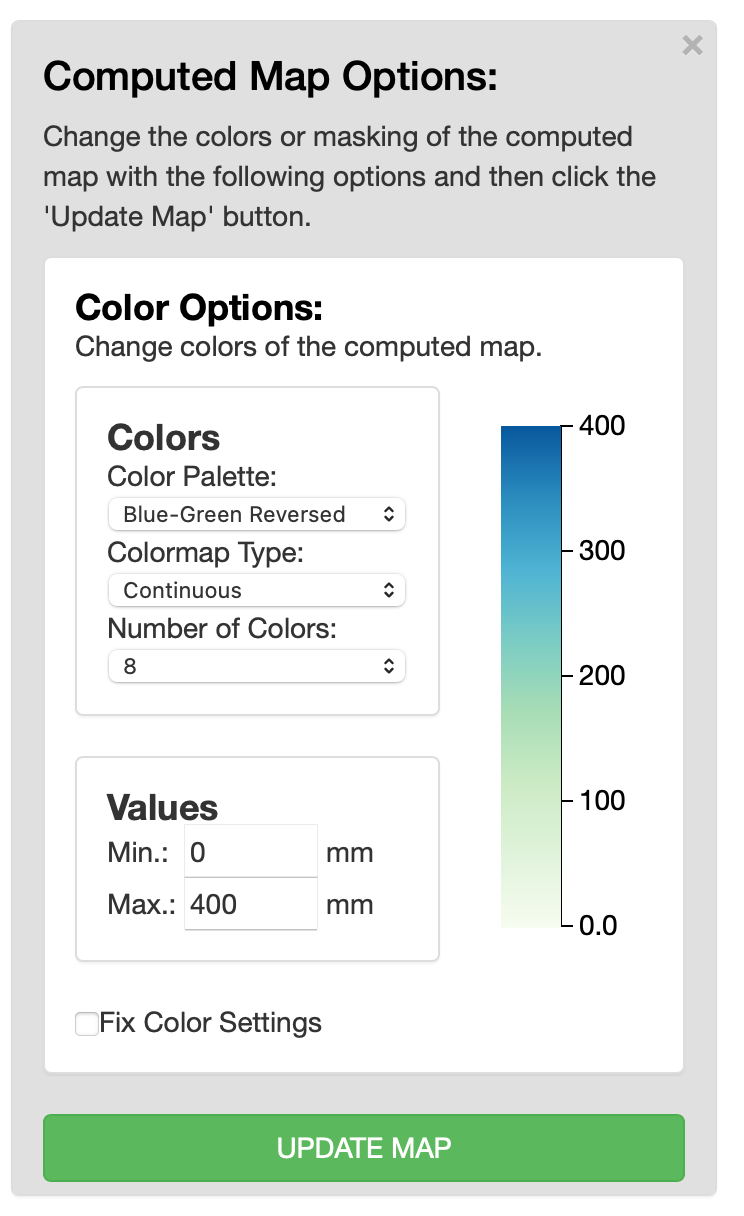
Here you can modify the:
- Color Palette: Choose from a long list of color palettes (either sequential or divergent, as well as a few special color palettes like the US Drought Monitor -USDM- red-white-blue or blue-white-red palettes).
- Colormap Type: Choose from either a continuous mapping or a discrete mapping of values to colors.
- Number of Colors: Choose from 3 to 11 colors used in the color palette.
- Values: Choose values to set the minimum (Min) and maximum (Max) used in the linear scaling of the colorbar.
Once your customization selections are made, you do need to click the green UPDATE MAP LAYER button to get a new map.
Customize Base Map
Climate Engine allows you to customize your map with modification of the base map. The default base map is the ‘Hybrid’ background. There are a couple of other standard base maps to choose from. You can modify the standard base map by clicking on the name of the current basemap (i.e. Hybrid) located in the Base Maps drop down in the selection panel at the top of the page. Simply select a new base map and the map will update immediately.
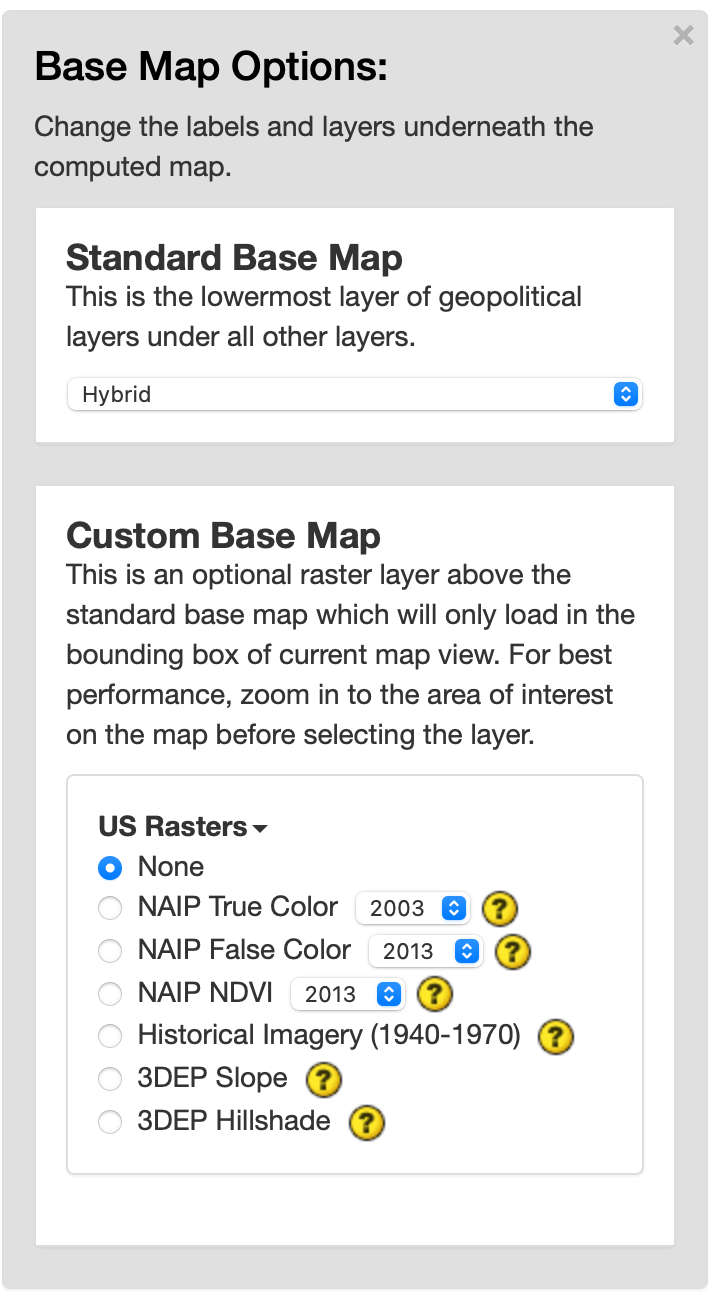
If you are interested in a custom base map, such as high-resolution imagery and high-resolution digital elevation models (DEMs), Climate Engine also has the option to select a custom base map in the same dropdown. Here you will see toggles for the different raster options. The default is set to None. To learn more about each data option, click on the (?) next to the layer. This will direct you to a documentation page. You can only select one option at a time. If you are selecting an option with year options, update the drop down to the year of interest. Then click the circle next to the layer of interest to turn it on. This will add the layer to the map. The Legend will appear below the Status section. Note: Not all years have imagery for all areas. If you select a Custom Base Map with year options, green text noting years available will appear when that option is selected. Additionally, for best performance, zoom in to the area of interest on the map before selecting the layer.
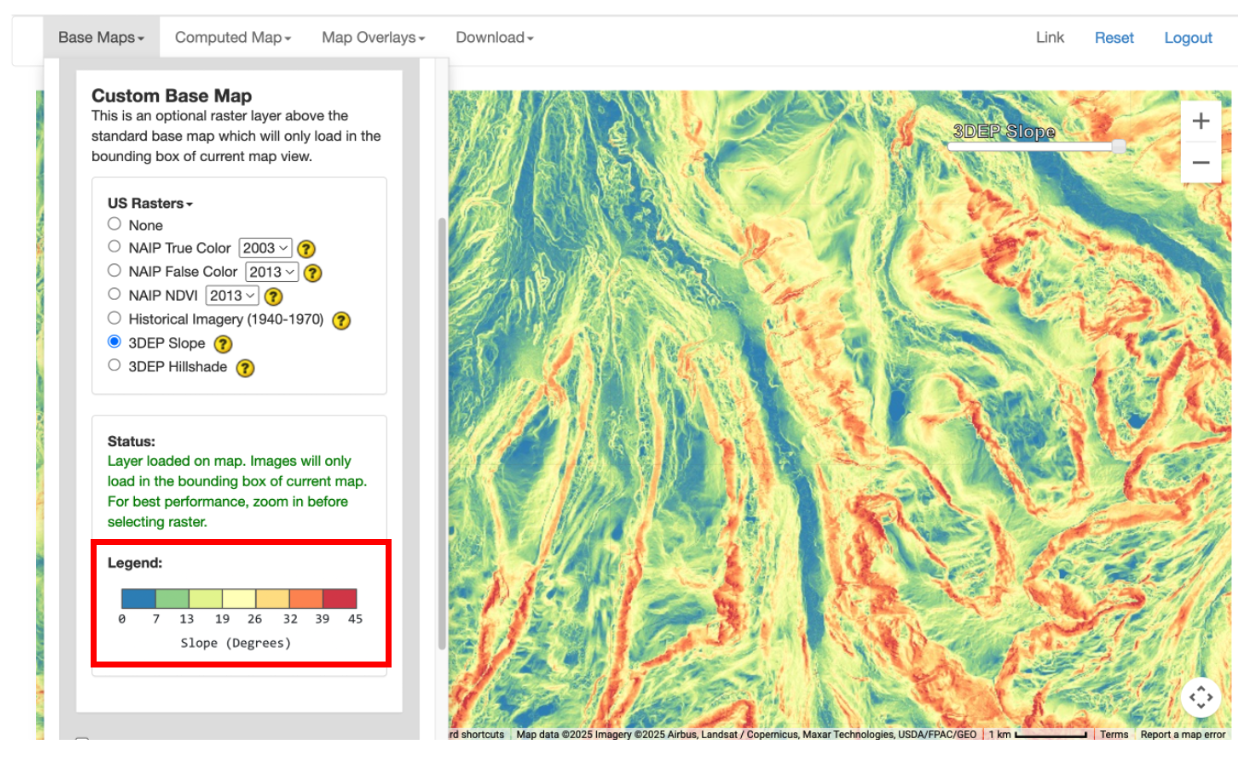
To control the visibility of the custom base map just added, you can adjust the transparency toggle added to the map.
Add Overlays
Climate Engine allows you to customize your map by adding overlays to provide additional context to the analysis. To add overlays to your map, you should click on the Map Overlays button in the selection panel above the map. This will open a dropdown of raster and vector options.
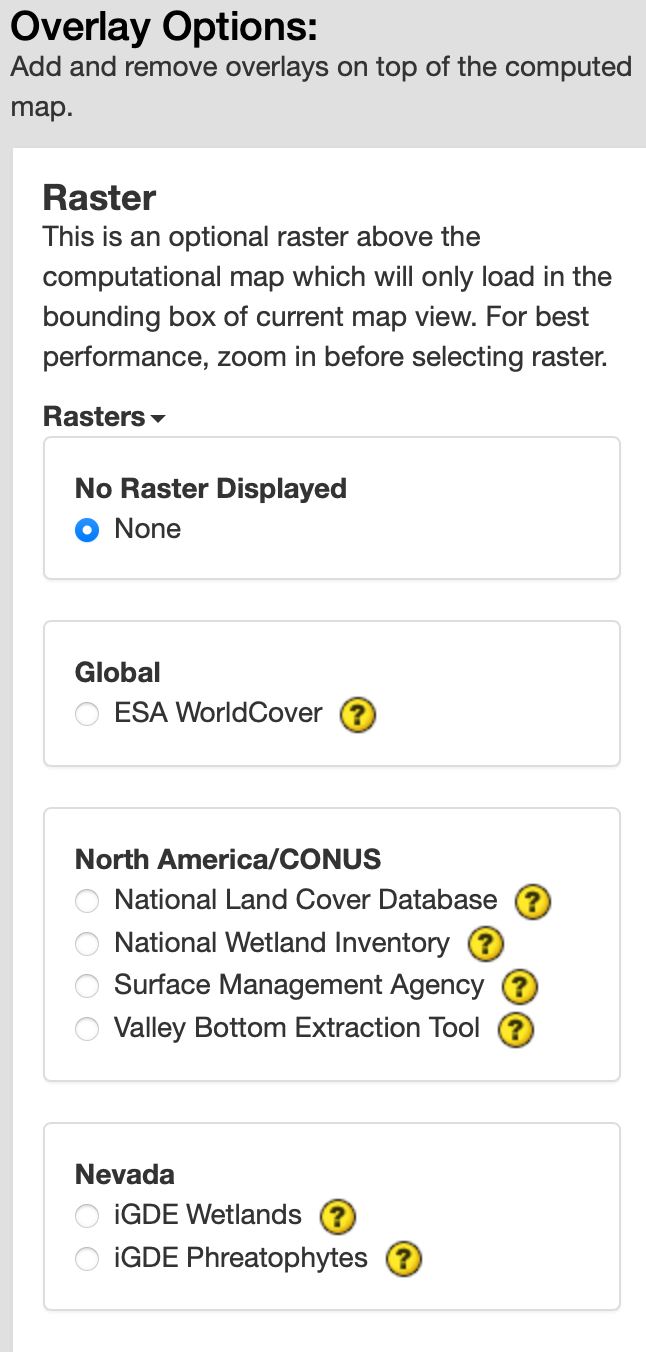
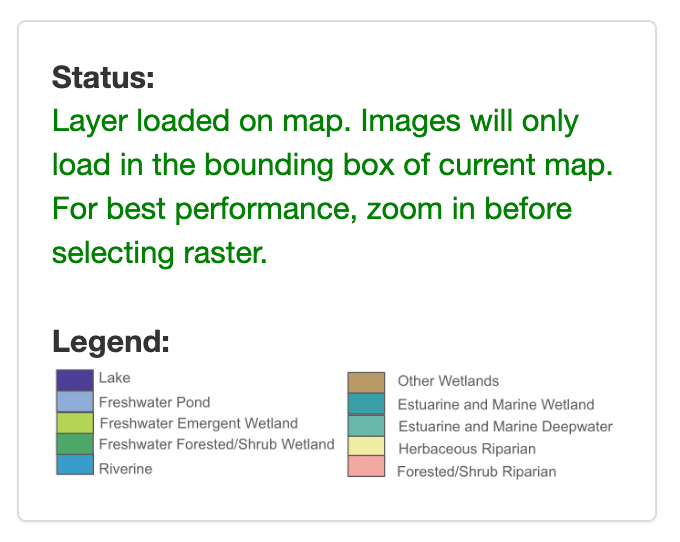
In the Raster section, you will see toggles for the different raster options. The default is set to None. To learn more about each data option, click on the (?) next to the layer. This will direct you to a documentation page. You can only select one option at a time. Then click the circle next to the layer of interest to turn it on. This will add the layer to the map above any base maps or computed maps. The Legend will appear below the Status section. To control the visibility of the custom base map just added, you can adjust the transparency toggle added to the top right of the map.
In the **Vector Section, you can check the boxes for various boundaries provided by Climate Engine.
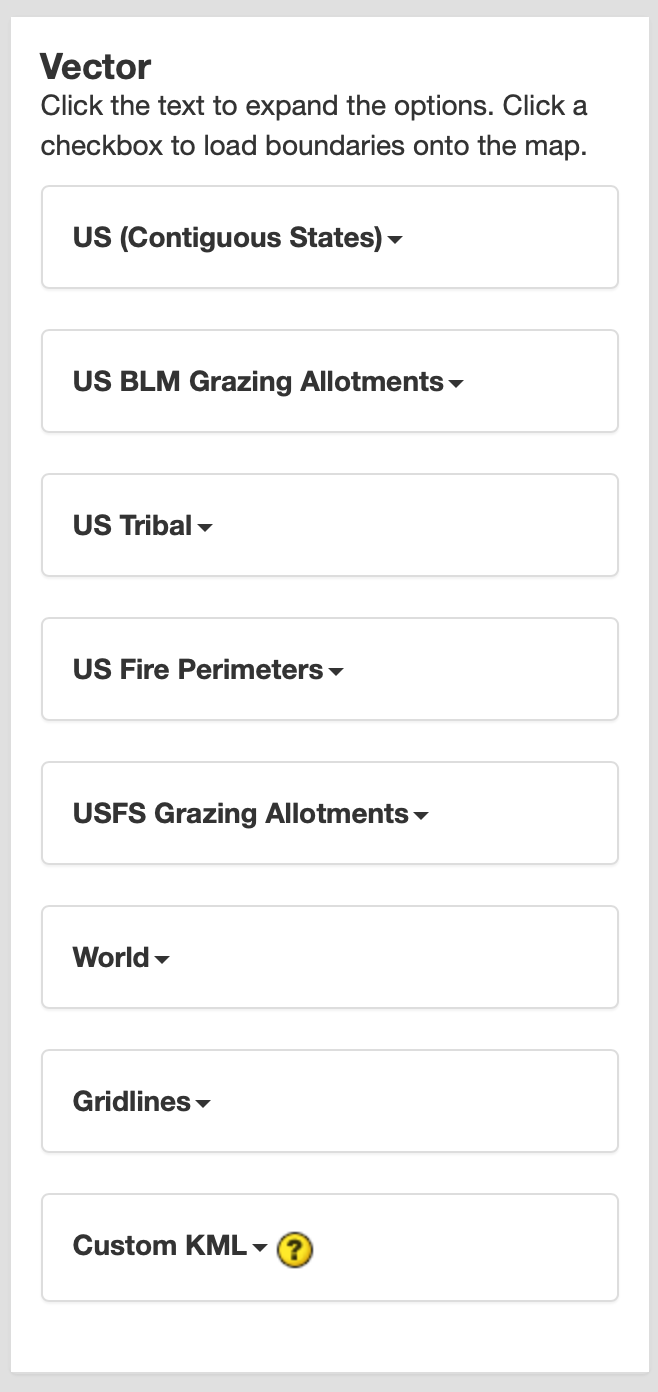
You can add up to two of your own boundary layers to the map if you have a .kml or .kmz file for your boundary and it is located on the internet with a valid URL. To add a shape from a kml to the Climate Engine map, you should check the box for ‘URL for .KML/.KMZ’ and then enter the URL for the kml in the text box. Once you finish entering the URL location or click the checkbox, your layer will be loaded on the map. Note that you may need to zoom into the location to actually see your boundary on the map.