ERA5 Ag - 9.6km - Daily
Description
Daily surface meteorological data for the period from 1979 to present as input for agriculture and agro-ecological studies. This dataset is based on the hourly ECMWF ERA5 data at surface level and is referred to as AgERA5. Acquisition and pre-processing of the original ERA5 data is a complex and specialized job. By providing the AgERA5 dataset, users are freed from this work and can directly start with meaningful input for their analyses and modelling. To this end, the variables provided in this dataset match the input needs of most agriculture and agro-ecological models. Data were aggregated to daily time steps at the local time zone and corrected towards a finer topography at a 0.1 deg spatial resolution. The correction to the 0.1 deg grid was realized by applying grid and variable-specific regression equations to the ERA5 dataset interpolated at 0.1 deg grid. The equations were trained on ECMWF's operational high-resolution atmospheric model (HRES) at a 0.1 deg resolution. This way the data is tuned to the finer topography, finer land use pattern and finer land-sea delineation of the ECMWF HRES model.
Climate Engine details
- Dataset type
- Climate/Hydrology
- Climate Engine ID
- ERA5_AG
- Documentation
- https://support.climateengine.org/article/58-era5-ag
Dataset details
- Scale
- 9.6km
- Frequency
- Daily
- Coverage
- Global
- Start year
- 1979
- End year
- Present
Earth Engine collection details
- Earth Engine asset
- projects/climate-engine-pro/assets/ce-ag-era5-v2/daily
- Earth Engine asset URL
- https://gee-community-catalog.org/projects/agera5_datasets/?h=era5+ag
- Earth Engine source catalog
- ClimateEngine.org
Variables
API variable docs: #era5-ag-v20-daily
| Name | Units |
|---|---|
| Climatic Water Balance (PPT-ETo) | mm |
| Dewpoint Temperature (2 m) | C |
| Downward shortwave radiation | W/m2 |
| Evap. Demand Drought Index Hargreaves (EDDI) | N/A |
| Evaporative Demand Drought Index (EDDI) | N/A |
| FAO Reference Evapotranspiration | mm |
| Maximum Temperature (2 m) | C |
| Mean Temperature (2 m) | C |
| Minimum Temperature (2 m) | C |
| Potential ET Hargreaves | mm |
| Potential Water Deficit Hargreaves | mm |
| Precipitation flux | mm |
| Snow thickness | cm |
| Snow thickness LWE | cm |
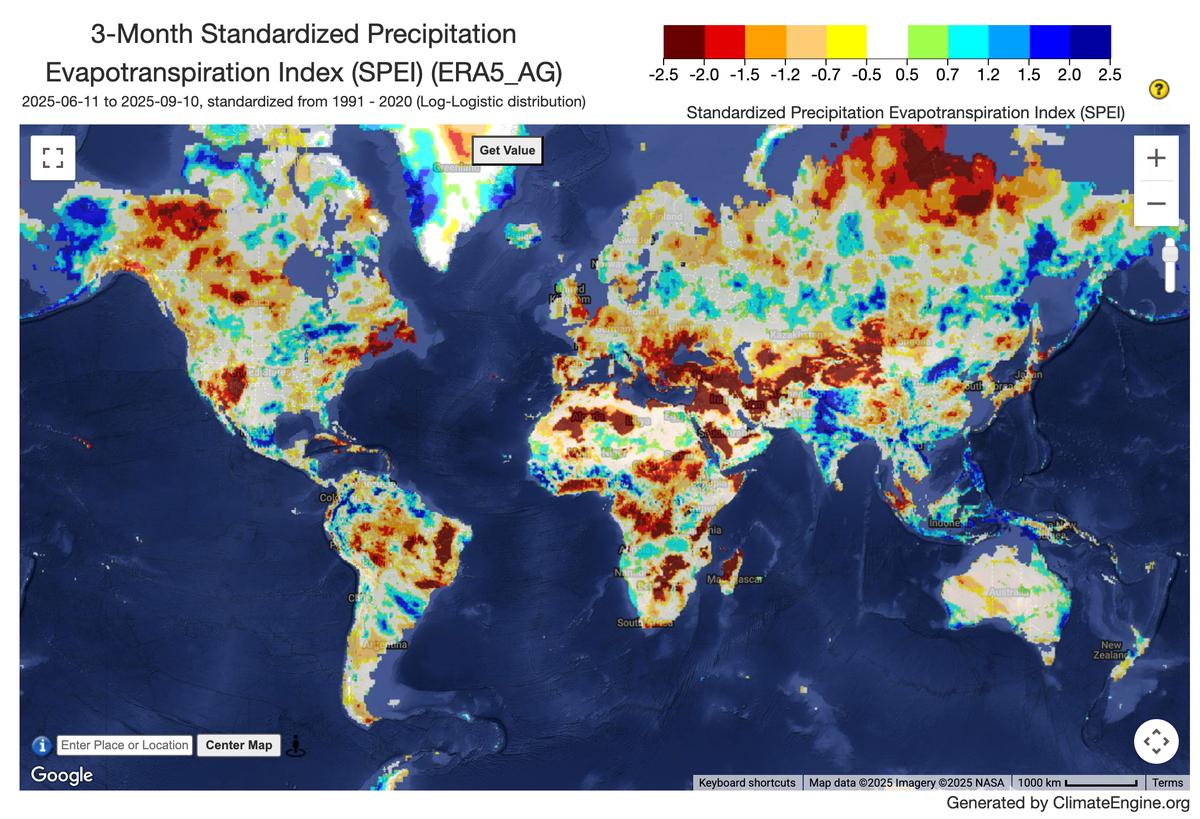
| Standardized Precipitation Evapotranspiration Index (SPEI) | N/A |
| Standardized Precipitation Evapotranspiration Index Hargreaves (SPEI) | N/A |
| Standardized Precipitation Index (SPI) | N/A |
| Vapor Pressure Deficit | kPa |
| Vapour Pressure | kPa |
| Wind speed (10 m) | m/s |
References
- Boogaard, H., Schubert, J., De Wit, A., Lazebnik, J., Hutjes, R., Van der Grijn, G., (2020): Agrometeorological indicators from 1979 to present derived from reanalysis. Copernicus Climate Change Service (C3S) Climate Data Store (CDS). DOI: 10.24381/cds.6c68c9bb (Accessed on DD-MMM-YYYY)
Website: https://cds.climate.copernicus.eu/cdsapp#!/dataset/sis-agrometeorological-indicators?tab=overview
Terms of use
Find license information here (see license tab): https://cds.climate.copernicus.eu/cdsapp#!/dataset/sis-agrometeorological-indicators?tab=overview